5. Science Use Cases
Before diving into more detailed concepts for specific tools, it is useful to have some examples of how the tools might be used. Because the tools are meant to be general-purpose and because the science program on JWST diverse, these use cases are meant to be illustrative rather than exhaustive. We focus in particular on JWST, but many of the tasks are similar for other observatories.
To illustrate the use cases, flow digrams are shown for different types of JWST science. These flow diagrams start where the JWST pipeline leaves off. The data have been calibrated, rectified, co-added, and extracted according to the standard pipeline algorithms. We assume that these calibrations are sufficient, or that the astronomer can re-run the pipeline if needed. The steps shown here are much more difficult to support in a general-purpose pipeline, because they often depend on the specific science goals and require inspection and judgement from the investigator at various steps. They may also combine data from other missions, which is beyond the scope of the JWST pipeline.
5.1. Faint Galaxies
A core science area for JWST involves imaging of faint galaxies. Observations will generally be in multiple bands, which may or may not be observed with the same guide stars. The different bands will have different point-spread functions. The investigator will often want to combine the JWST images with other data sets from other observatories. The flow diagram below shows various tasks that an astronomer would be expected to combine the data, perform custom measurements, derive physical quantities for individual galaxies, and construct statistical distributions for comparison to theory.
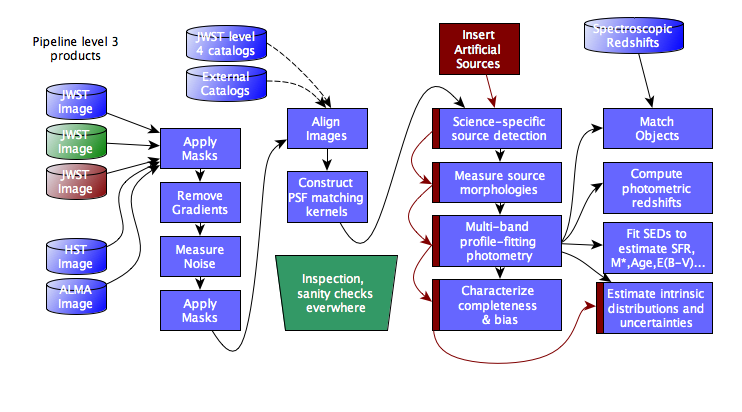
Illustration of the data flow for a multi-wavelength survey of faint galaxies. The JWST inputs are the individual images from different bands and the JWST level 4 catalogs. The first steps involve inspecting and cleaning up the data, which might have scattered light from surrounding bright sources or might be slightly misaligned due to the use of different guide stars. Any mis-alignments between the JWST images and comparison images from other observatories will also need to be measured and corrected. Detailed photometric comparisons will require efforts to account for the different spatial resolution – which generally involves constructing PSF kernels to allow a higher resolution image to be convolved to lower resolution. Those psf kernels are then applied in various ways to detect source, measure their morphologies, and measure their fluxes. To characterize incompleteness and measurement biases, these steps are also generally carried out on artificial sources that were inserrted into the real images. The resulting catalogs are often matched to existing catalogs (e.g. of measured redshifts), and various physical quantities and statistical distributions are derived from the measurements.
5.2. Infrared Slit Spectroscopy of Galactic Objects
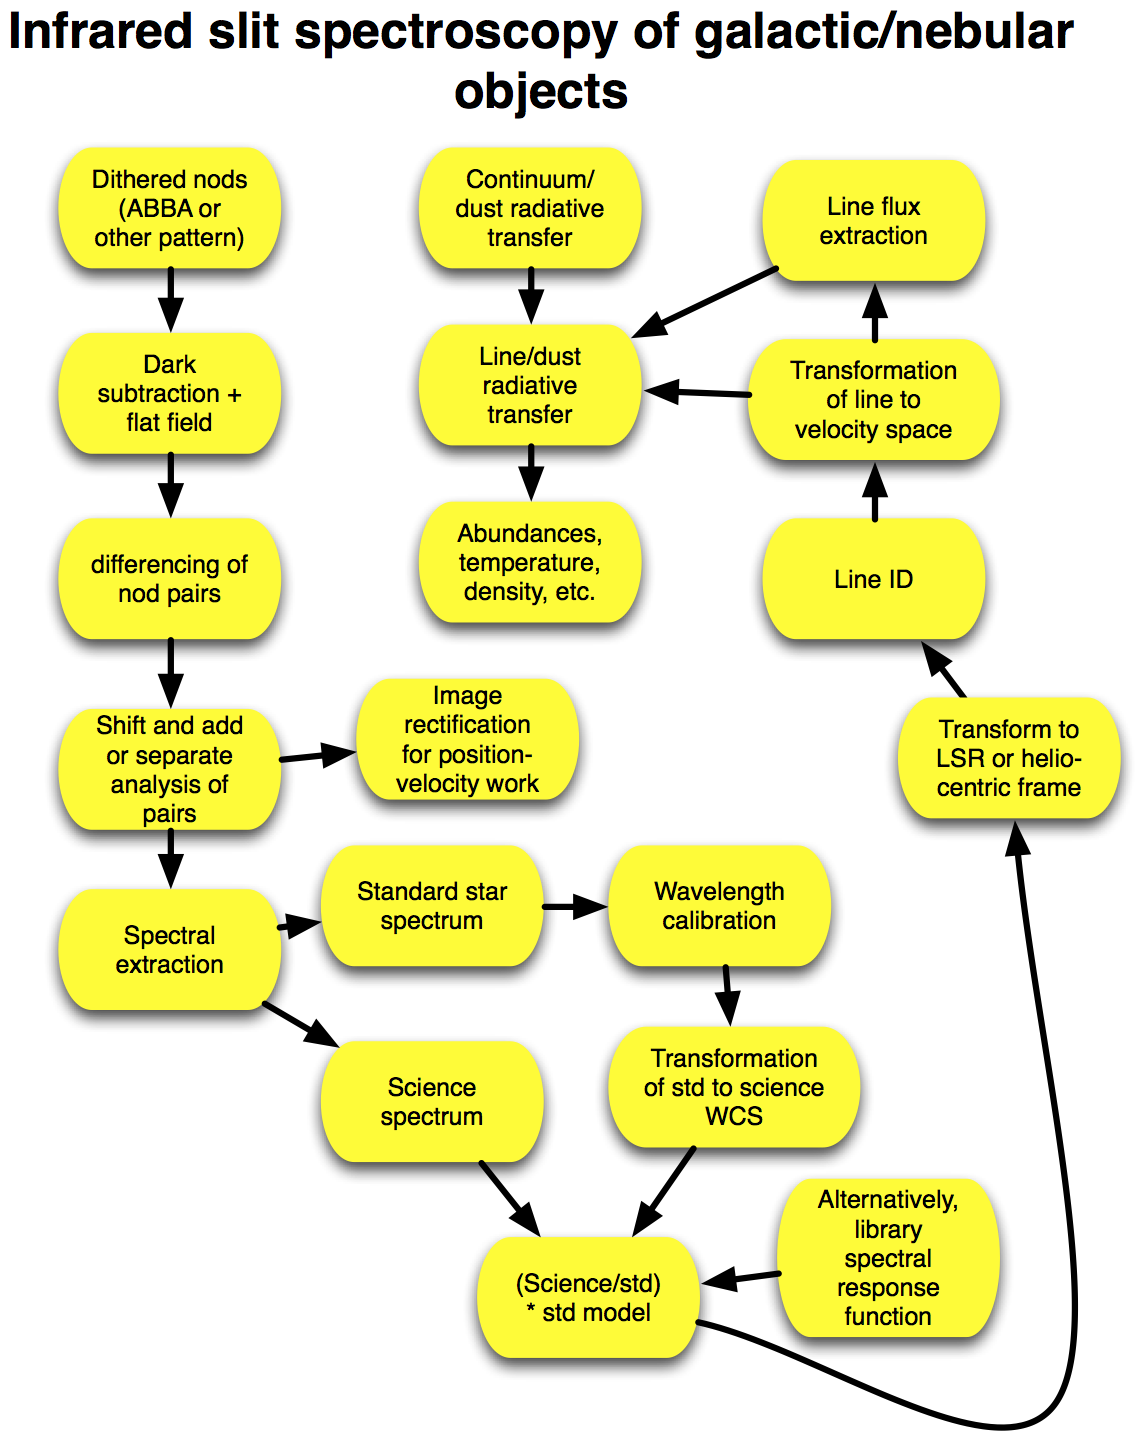
For long-slit or multi-slit spectroscopy, the JWST pipeline will present the astronomer with extracted one-dimensional spectra that are wavelength and flux calibrated. Other observatories may or may not have an automated pipeline which does that. Even for JWST, the cautious astronomer is going to want to carefully check the results in the first year or two of JWST operations.
Further analysis will involve identifying spectral features (or cross-correlating with models), and determining parameters such as fluxes, equivalent widths, or line profiles. Analysis often includes sophisticated modeling. In some cases, the models are compared to compared to these derived quantities (which must have well-understood uncertainties). In other cases, the models are used to generate simulated spectra (with as high fidelity as possible) and are compared directly to the data.
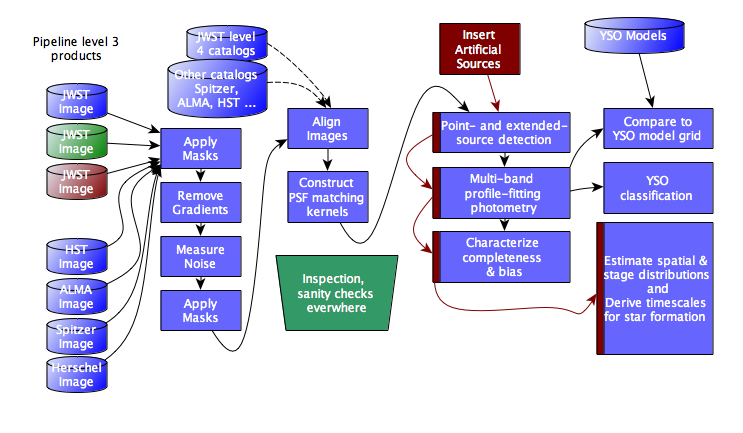
5.3. Imaging Young Stellar Objects in the Magellanic Clouds
The flow for multi-wavelength imaging of nearby objects shares many of the steps needed for faint-galaxy studies, including image alignment, registration and PSF-matching to other data sets (images and catalogs), source detection and characterization, and artificial source injection.
5.4. Need more use cases
Need more use cases!